IC Markets Home Assinar em Web Trader Contacte-nos
IC Markets Social IC Markets Social

Centro de Informação para
Traders Sérios

  • Sobre nós
  • ABRA UMA CONTA DE NEGOCIAÇÃO
  • TESTE UM DEMO GRATUITO
  • Comece a Operar
  • Visite nosso blog
IC Markets Social
  • Sobre nós
  • ABRA UMA CONTA DE NEGOCIAÇÃO
  • TESTE UM DEMO GRATUITO
  • Comece a Operar
  • Visite nosso blog
May 6, 2024Australian_Stocks_enIC Markets

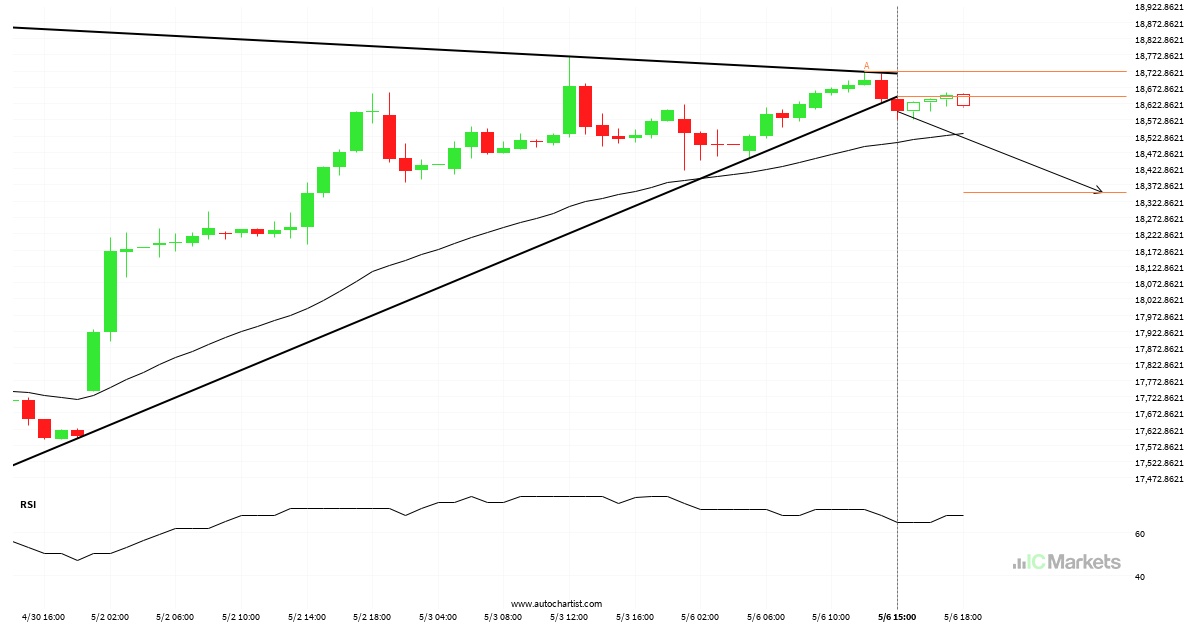
bearish technical pattern on Hong Kong 50 Index 1 hour

The breakout of Hong Kong 50 Index through the support line of a Triangle could be a sign of the road ahead. If this breakout persists, we may see the price of Hong Kong 50 Index testing 18348.8031 within the next 12 hours.

Read more
May 6, 2024Australian_Stocks_enIC Markets

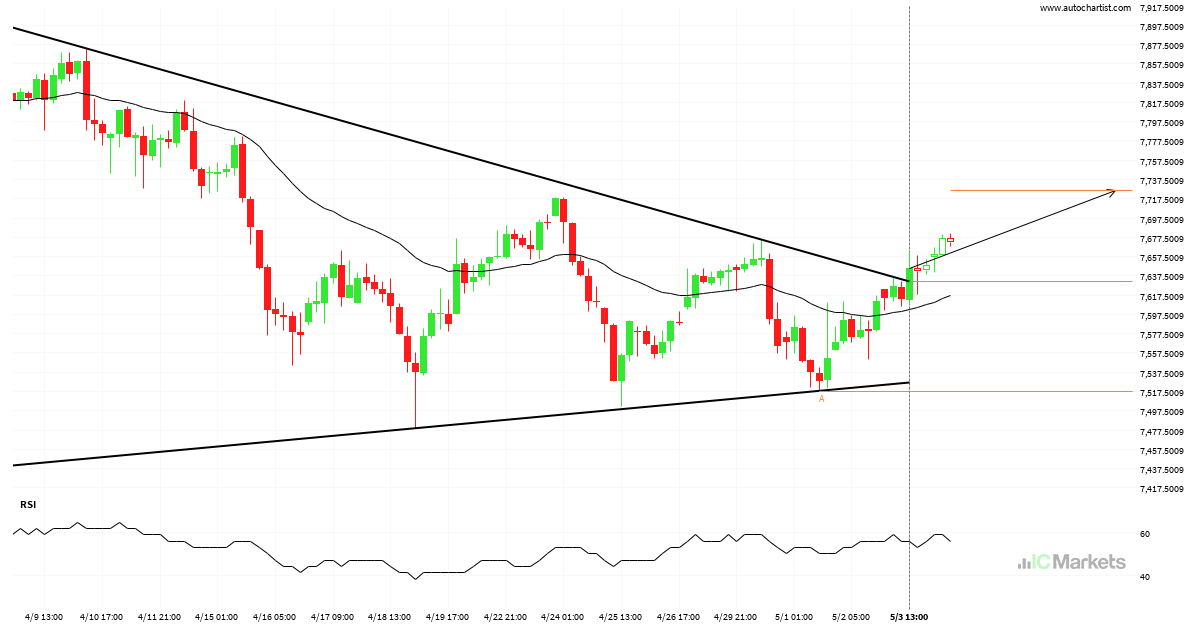
bullish technical pattern on Australia 200 Index 4 hour

Australia 200 Index has broken through a resistance line of a Triangle and suggests a possible movement to 7725.7632 within the next 3 days. It has tested this line in the past, so one should probably wait for a confirmation of this breakout before taking action. If the breakout doesn’t confirm, we could see a […]

Read more
May 2, 2024Australian_Stocks_enIC Markets

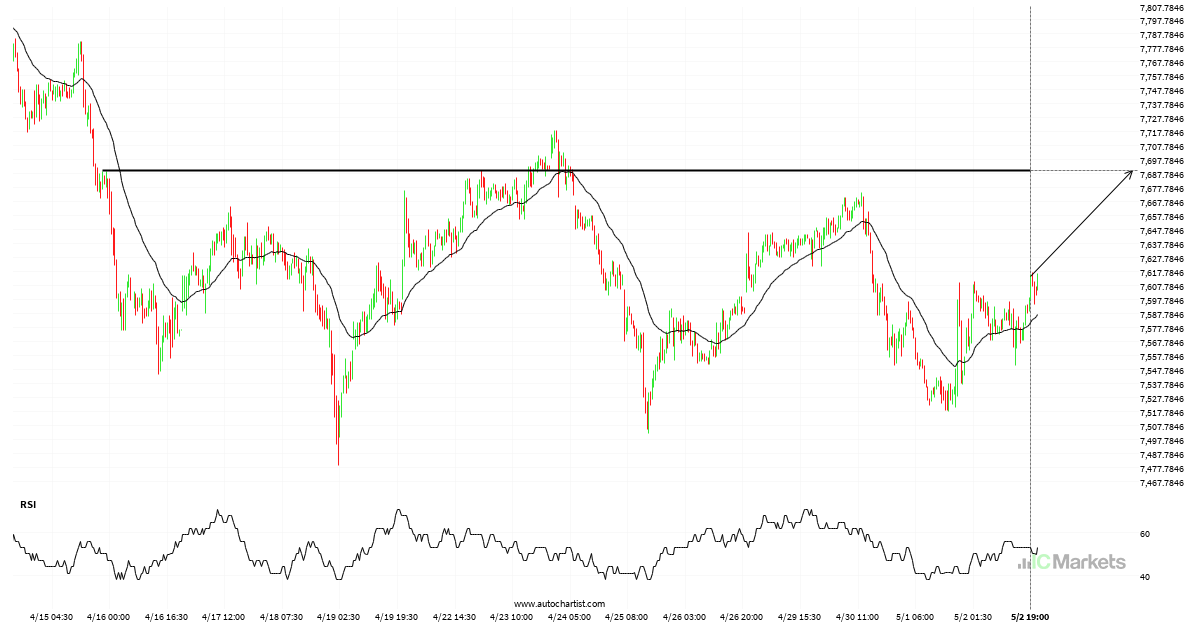
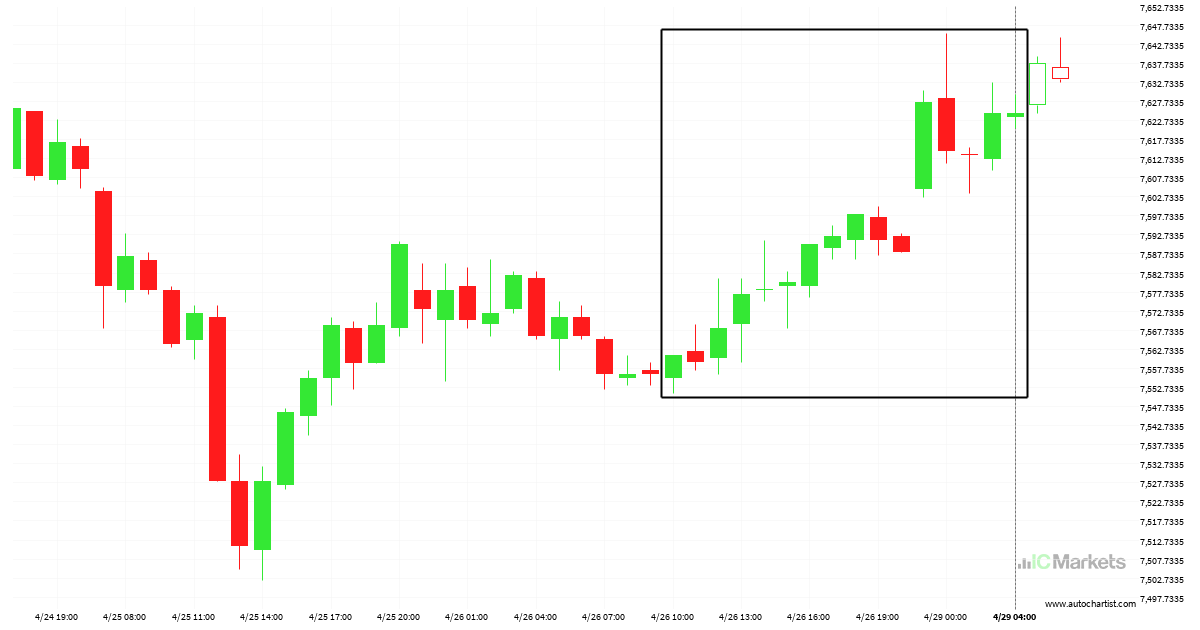
Australia 200 Index approaching resistance level

Australia 200 Index is moving towards a key resistance level at 7689.8701. Australia 200 Index has previously tested this level 3 times and on each occasion it has bounced back off this level. Is this finally the time it will break through?

Read more
May 1, 2024Australian_Stocks_enIC Markets

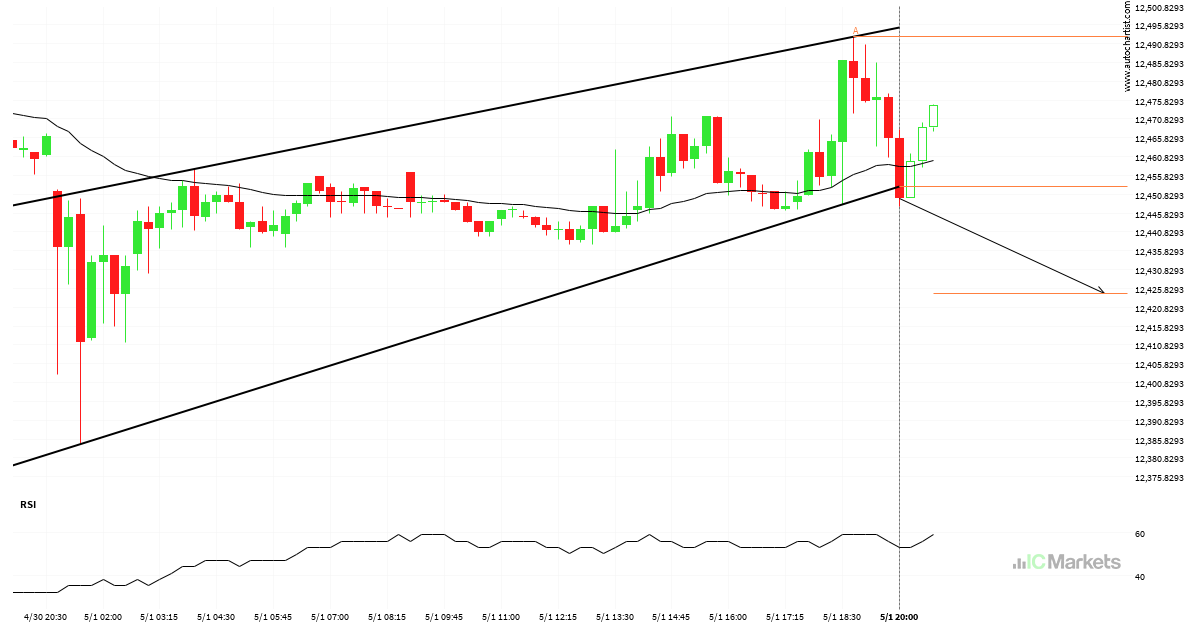
FTSE China A50 Index – support line breached

FTSE China A50 Index has broken through the support line of a Rising Wedge technical chart pattern. Because we have seen it retrace from this line in the past, one should wait for confirmation of the breakout before taking any action. It has touched this line twice in the last 2 days and suggests a […]

Read more
April 30, 2024Australian_Stocks_enIC Markets

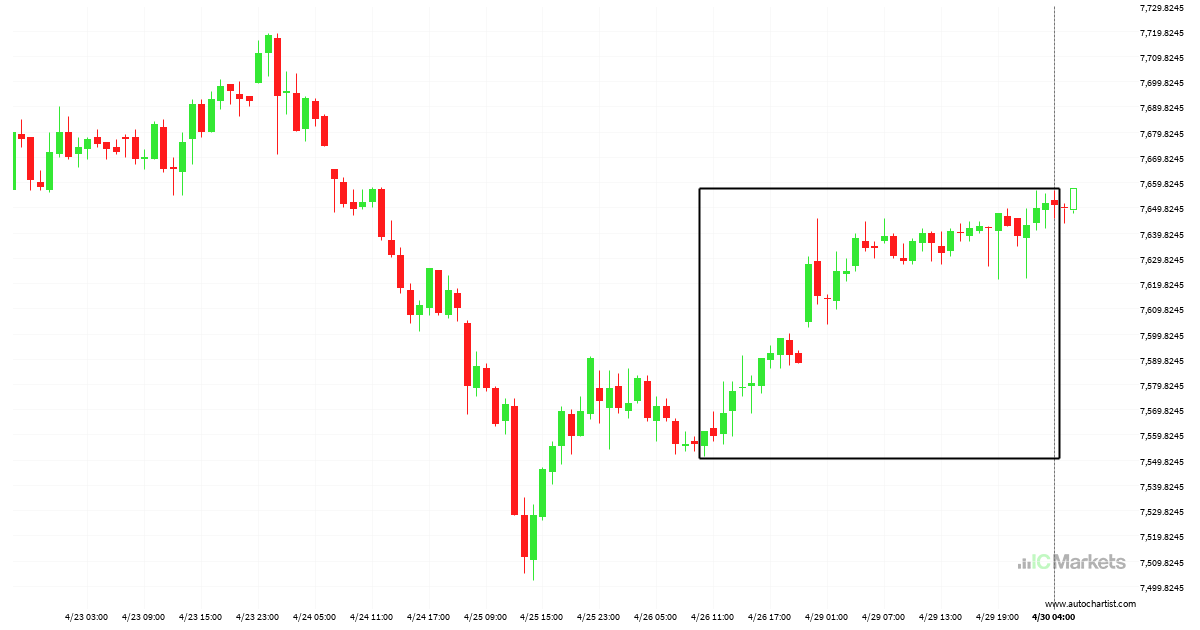
Huge bullish move on Australia 200 Index

Australia 200 Index hits 7650.67 after a 1.18% move spanning 4 days.

Read more
April 29, 2024Australian_Stocks_enIC Markets

Huge movement on Australia 200 Index, did you miss it?

Australia 200 Index has moved higher by 0.84% from 7561.2 to 7624.56 in the last 3 days.

Read more
April 26, 2024Australian_Stocks_enIC Markets

Australia 200 Index – Continuation Chart Pattern – Channel Up

Australia 200 Index was identified at around 7590.09 having recently rebounded of the support on the 4 hour data interval. Ultimately, the price action of the stock has formed a Channel Up pattern. This squeeze may increases the chances of a strong breakout. The projected movement will potentially take the price to around the 7756.3847 […]

Read more
April 25, 2024Australian_Stocks_enIC Markets

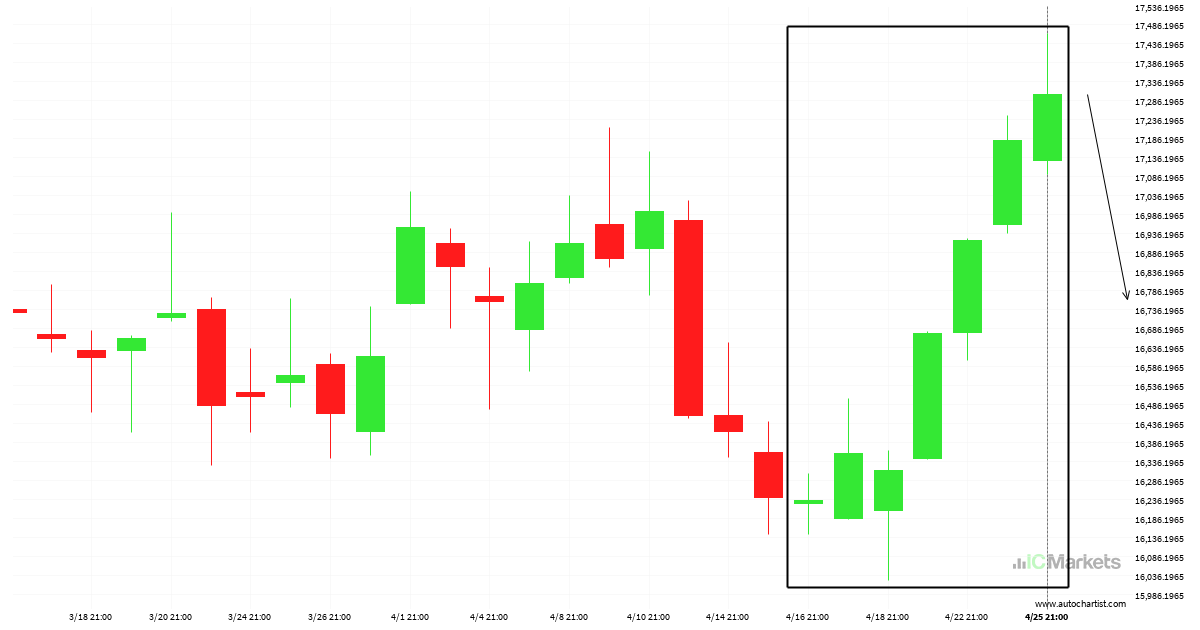
Hong Kong 50 Index – Large movement, a rare opportunity

Due to the rate of consecutive bullish candles on Hong Kong 50 Index Daily chart we could be in for a price correction. If not, this trend could be a sign of things to come

Read more
April 24, 2024Australian_Stocks_enIC Markets

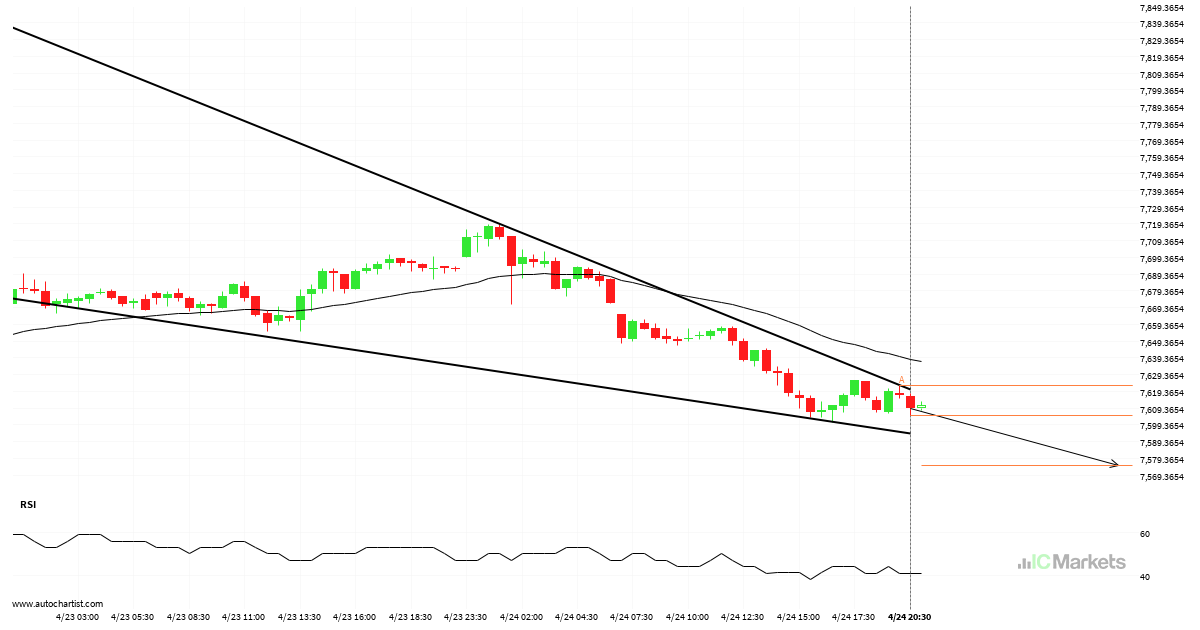
Australia 200 Index approaching support of a Falling Wedge

Australia 200 Index is approaching the support line of a Falling Wedge. It has touched this line numerous times in the last 3 days. If it tests this line again, it should do so in the next 11 hours.

Read more
April 22, 2024Australian_Stocks_enIC Markets

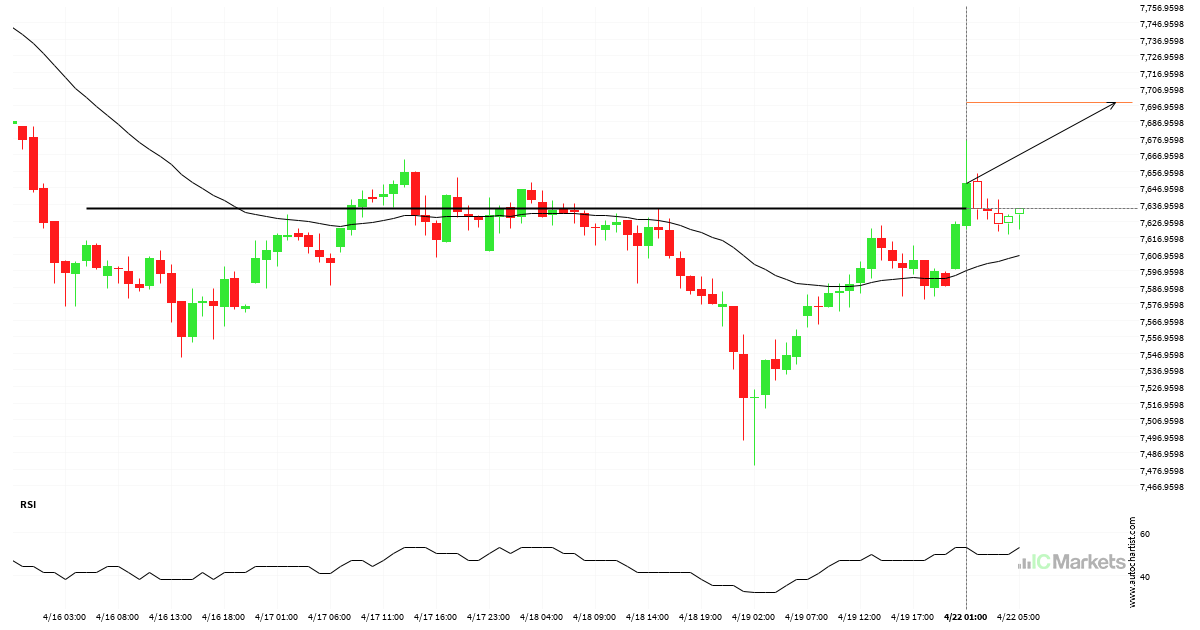
Australia 200 Index breakout through resistance

Australia 200 Index has breached the resistance line at 7634.2998. It may continue the bullish trend towards 7698.5942, or, it may prove to be yet another test of this level.

Read more
  • 1
  • 2
  • 3
  • …
  • 11
  • 12
  • 13
  • 14
  • 15
  • 16
  • 17
  • …
  • 153
  • 154
  • 155

Recent Posts

  • Either a rebound or a breakout imminent on SILVER
  • GOLD Nível visado: 2976.3601
  • A potential bearish movement on GOLD
  • มีโอกาสเกิดการเคลื่อนตัวแบบ bearish บน GOLD
  • Posible gran movimiento en el AUDJPY

Recent Comments

    Translation


     Edit Translation

    Negocie com um

    líder de mercado no qual possa confiar

    ABRA UMA CONTA DE NEGOCIAÇÃO TESTE UM DEMO GRATUITO

    Trading com Forex

    • Visão Geral de Contas
    • Abrir uma Conta
    • Lançar Web Trader

    Especificações de Trading

    • Spreads e Comissões
    • Gama de Mercados
    • Horas de Trading
    • Financiamento
    • Levantamento

    Acerca da IC Markets?

    • Help Center
    • Porquê a IC Markets
    • Regulamentação
    • Documentos Legais
    • Contacte-nos


    Forex Trading

    • Accounts Overview
    • Open an Account
    • Launch Web Trader

    Trading Specifications

    • Spreads and Commissions
    • Range of Market
    • Trading Hours
    • Funding
    • Withdrawal

    About IC Markets

    • Chat with a Specialist 24/7
    • Why IC Markets
    • Regulation
    • Legal Documents
    • Contacte-nos

    Isenção de Responsabilidade: Este material corresponde a material de marketing em que todo o material de marketing é publicado apenas para fins informativos. Este material não contém e não deverá ser considerado como contendo - aconselhamento de investimento e recomendações ou sugestões para adotar quaisquer ações relativamente a instrumentos financeiros. Os widgets incorporados pertencem aos seus autores externos independentes e a IC Markets não é responsável pelo seu conteúdo ou pelo seu impacto na negociação.

    Todos os direitos de conteúdo reservados. As opiniões dos autores poderão não coincidir com a opinião dos editores do blog. Aquando da cópia de materiais a partir deste site ou aquando da ligação ao RSS feed, para republicar os nossos artigos, é necessário um link para a IC Markets ou a atribuição no formato 'IC Markets Blog'. Para questões gerais, por favor, entre em contato com a agência editorial através do formulário da nossa página de Contato.

    Alerta de Risco: A negociação de Derivados acarreta um elevado nível de risco para o seu capital e deverá negociar apenas com dinheiro cuja perda possa suportar. A Negociação de Derivados poderá não ser adequada para todos os investidores e, como tal, por favor, certifique-se de que entende plenamente os riscos envolvidos e procure aconselhamento independente, se necessário. Deverá ser considerada uma Declaração de Divulgação de Produto (PDS) antes de efetuar uma transação connosco.

    O conteúdo desta página corresponde apenas a informação geral e não tem em conta a sua situação pessoal, objetivos ou necessidades financeiras. Cabe-lhe a si certificar-se de que os produtos que nós oferecemos se adequam às suas necessidades específicas. Não deverá negociar connosco, a menos que entenda as caraterísticas e os riscos dos produtos que nós oferecemos. Isto significa que poderá precisar de procurar aconselhamento independente antes de começar a negociar connosco.

    © 2022 Raw Trading Ltd | All rights reserved.
    • Sample Page